Poverty & Inequality in India: Measurement Methods, Committees, Gini Coefficient & Latest Data
Learn about poverty and inequality in India: absolute vs relative poverty, Tendulkar and Rangarajan committees, MPI, and how to calculate the Gini coefficient.
Poverty and inequality remain central themes in India's development discourse. While rapid economic growth since 1991 has pulled millions out of extreme poverty, income and wealth inequality have concurrently widened. This article provides comprehensive university-level notes on the measurement of poverty in India, the evolution of expert committees (like the Tendulkar committee poverty line), the measurement of inequality via the Gini coefficient, and major government anti-poverty programmes.
1. Absolute vs Relative Poverty
Absolute Poverty: A condition characterized by severe deprivation of basic human needs, including food, safe drinking water, sanitation facilities, health, shelter, education, and information. It is measured against a fixed benchmark (the poverty line).
Relative Poverty: Defines poverty in relation to the economic status of other members of the society. It essentially measures inequality. A person is poor if their income is significantly lower than the median income of the country.
2. Evolution of Poverty Measurement in India
India measures absolute poverty primarily using consumption expenditure data collected by the National Sample Survey Office (NSSO), rather than income data, because consumption is more stable and better reflects actual living standards.
Key Expert Committees
A. Alagh Committee (1979)
Constructed a poverty line based entirely on nutritional requirements. The minimum calorie intake was set at:
- Rural: 2400 kcal per capita per day
- Urban: 2100 kcal per capita per day
B. Lakdawala Committee (1993)
Retained the calorie-based methodology but recommended state-specific poverty lines using the Consumer Price Index for Agricultural Labourers (CPI-AL) for rural areas and the Consumer Price Index for Industrial Workers (CPI-IW) for urban areas.
C. Tendulkar Committee (2009)
Radically shifted the methodology by moving away from purely calorie-based anchors.
- Included private expenditure on health and education in the poverty line basket.
- Used a uniform poverty line basket (Urban) for both rural and urban areas, adjusted for price differences.
- Poverty lines defined: Rs 27 per day (Rural) and Rs 33 per day (Urban).
- Estimated India's poverty at 21.9% (for 2011-12).
D. Rangarajan Committee (2014)
Reverted partially to the normative calorie requirement but updated the basket.
- Calories: 2155 (Rural) and 2090 (Urban).
- Included normative levels for proteins and fats.
- Poverty lines defined: Rs 32 per day (Rural) and Rs 47 per day (Urban).
- Estimated India's poverty at 29.5% (for 2011-12).
Committee Comparison Table
| Feature | Lakdawala (1993) | Tendulkar (2009) | Rangarajan (2014) |
|---|---|---|---|
| Anchor | Calorie Intake | Broader Consumption (Health/Edu) | Calories + Proteins + Fats + Non-food |
| Poverty Line (2011-12) | - | Rural: ₹816/mo, Urban: ₹1000/mo | Rural: ₹972/mo, Urban: ₹1407/mo |
| Poverty % (2011-12) | - | 21.9% | 29.5% |
3. Modern Measurement: Multidimensional Poverty Index (MPI)
Moving beyond monetary measures, the UNDP's Global MPI and NITI Aayog's National MPI measure deprivation across three equally weighted dimensions:
- Health: Nutrition, Child & Adolescent Mortality, Maternal Health.
- Education: Years of schooling, School attendance.
- Standard of Living: Cooking fuel, sanitation, drinking water, electricity, housing, assets, bank accounts.
According to NITI Aayog, steep declines in multidimensional poverty have been observed recently due to heavy push in sanitation (Swachh Bharat) and cooking fuel (Ujjwala).
4. Measuring Inequality: Lorenz Curve & Gini Coefficient
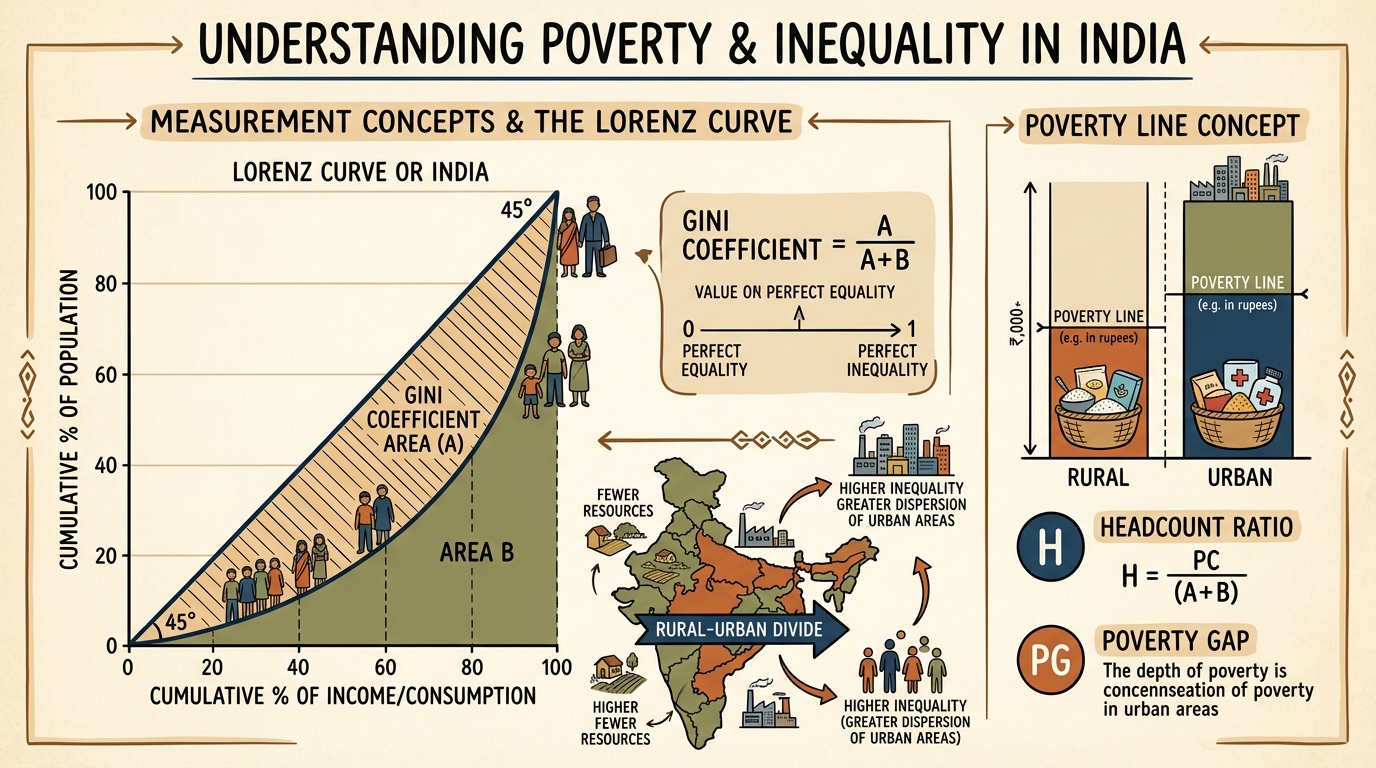
Lorenz Curve: A graphical representation of income distribution. The cumulative percentage of population is plotted on the x-axis, and the cumulative percentage of income on the y-axis. A perfectly equal society forms a 45-degree line (Line of Equality). The further the Lorenz curve bows away from this line, the higher the inequality.
Gini Coefficient: A numerical measure of inequality ranging from 0 (perfect equality) to 1 (perfect inequality). It is calculated as the area between the Line of Equality and the Lorenz curve, divided by the total area under the Line of Equality.
Gini = A / (A + B)
Kuznets Hypothesis: Proposes an inverted-U relationship between economic growth and inequality. As a poor country grows, inequality first increases (as workers move to higher-paying urban industry), peaks, and then decreases as welfare states emerge and human capital broadens.
Solved Example: Gini Calculation Approximation
Question: In a simplified economy of 5 people, incomes are 10, 20, 30, 40, and 100. Calculate cumulative shares to plot the Lorenz curve.
Solution:
Total Income = 10+20+30+40+100 = 200.
Population quintiles = 20% each.
Poorest 20%: Income share = 10/200 = 5%. Cumulative Pop = 20%, Cumul Income = 5%.
Next 20%: Income share = 20/200 = 10%. Cumul Pop = 40%, Cumul Income = 15%.
Next 20%: Income share = 30/200 = 15%. Cumul Pop = 60%, Cumul Income = 30%.
Next 20%: Income share = 40/200 = 20%. Cumul Pop = 80%, Cumul Income = 50%.
Richest 20%: Income share = 100/200 = 50%. Cumul Pop = 100%, Cumul Income = 100%.
Plotting these coordinates gives the Lorenz curve. The large jump at the end (richest 20% owning 50%) pulls the Gini coefficient up.
5. Common Poverty Metrics
- Headcount Ratio (HCR): Proportion of population living below the poverty line. (Number of poor / Total population).
- Poverty Gap Ratio (PGR): Measures the depth of poverty. It is the average shortfall of the total population from the poverty line. PGR = Mean distance below the poverty line (as a proportion of poverty line).
6. Anti-Poverty Programmes in India
The government attacks poverty through growth-driven and targeted welfare approaches:
- MGNREGA: Mahatma Gandhi National Rural Employment Guarantee Act guarantees 100 days of wage employment in a financial year to rural households.
- PDS (Public Distribution System): Ensures food security by distributing subsidized grains. Overhauled by the National Food Security Act (NFSA) 2013.
- PM-KISAN: Direct income support of ₹6000 per year to farmer families.
- Jan Dhan Yojana: Financial inclusion program ensuring bank accounts, vital for Direct Benefit Transfer (DBT) to plug leakages.
Exam-Style Solved Questions
Q1: Why is the Tendulkar methodology considered an improvement over Lakdawala?
Ans: Tendulkar moved away from a strict calorie anchor, acknowledging that health and education are essential non-food basic needs. It also unified the poverty basket across rural and urban lines, only adjusting for spatial price differentials, providing a more realistic baseline.
Q2: If the Headcount Ratio falls but the Poverty Gap Ratio increases, what does this imply?
Ans: It implies that while the total number of people below the poverty line has decreased (perhaps those just below the line crossed over), the people who remain in poverty have become even poorer, falling further below the poverty line.
Q3: Explain the role of DBT in poverty alleviation.
Ans: Direct Benefit Transfer bypasses bureaucratic layers, delivering cash subsidies directly to bank accounts (JAM trinity: Jan Dhan, Aadhaar, Mobile). This radically reduces inclusion/exclusion errors and ghost beneficiaries, ensuring state funds actually reach the targeted poor.
Frequently asked questions
What is the difference between absolute and relative poverty?
Absolute poverty refers to lacking basic needs, whereas relative poverty measures income inequality compared to others.
How is the Gini coefficient calculated?
It is the ratio of the area between the Lorenz curve and the line of equality to the total area under the line of equality.
Dhairya sat the same DU papers he now writes about. Acadly is his attempt to say the useful things his own first-year self would have wanted to hear.
Keep reading
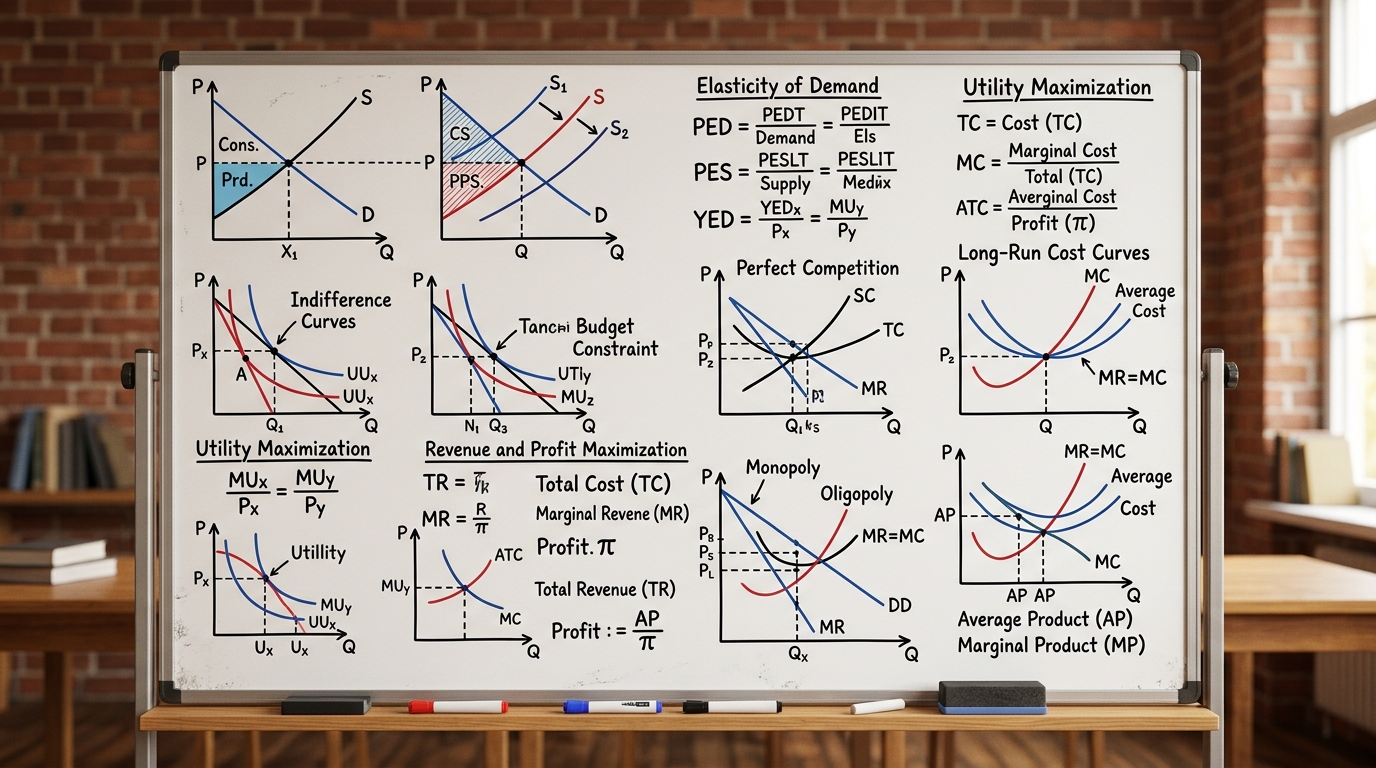
Microeconomics Formula Sheet & Key Theorems: The Complete DU Reference Guide
The ultimate cheat sheet for Intermediate Microeconomics I & II. Master Consumer Theory, Producer Theory, Market Structures, Game Theory, and Welfare Economics.
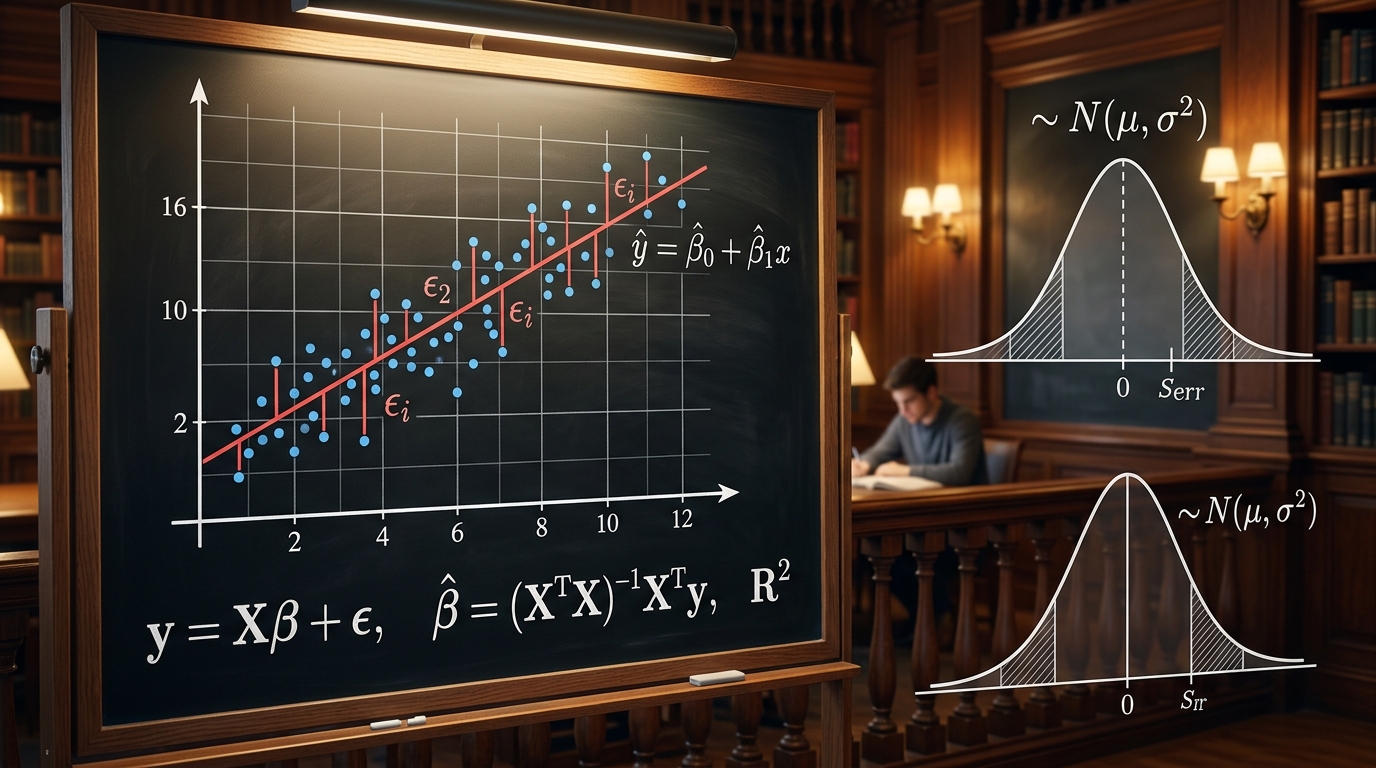
Introductory Econometrics & OLS Regression: Gauss-Markov Theorem, Proofs & Exam Numericals
Comprehensive 4,500-word masterclass on Introductory Econometrics and Ordinary Least Squares (OLS) for DU Economics students. Covers algebraic derivations of beta_0 and beta_1, Gauss-Markov BLUE proofs, R-squared variance decomposition, hypothesis testing (t and F-tests), and 3 fully worked numerical problems.
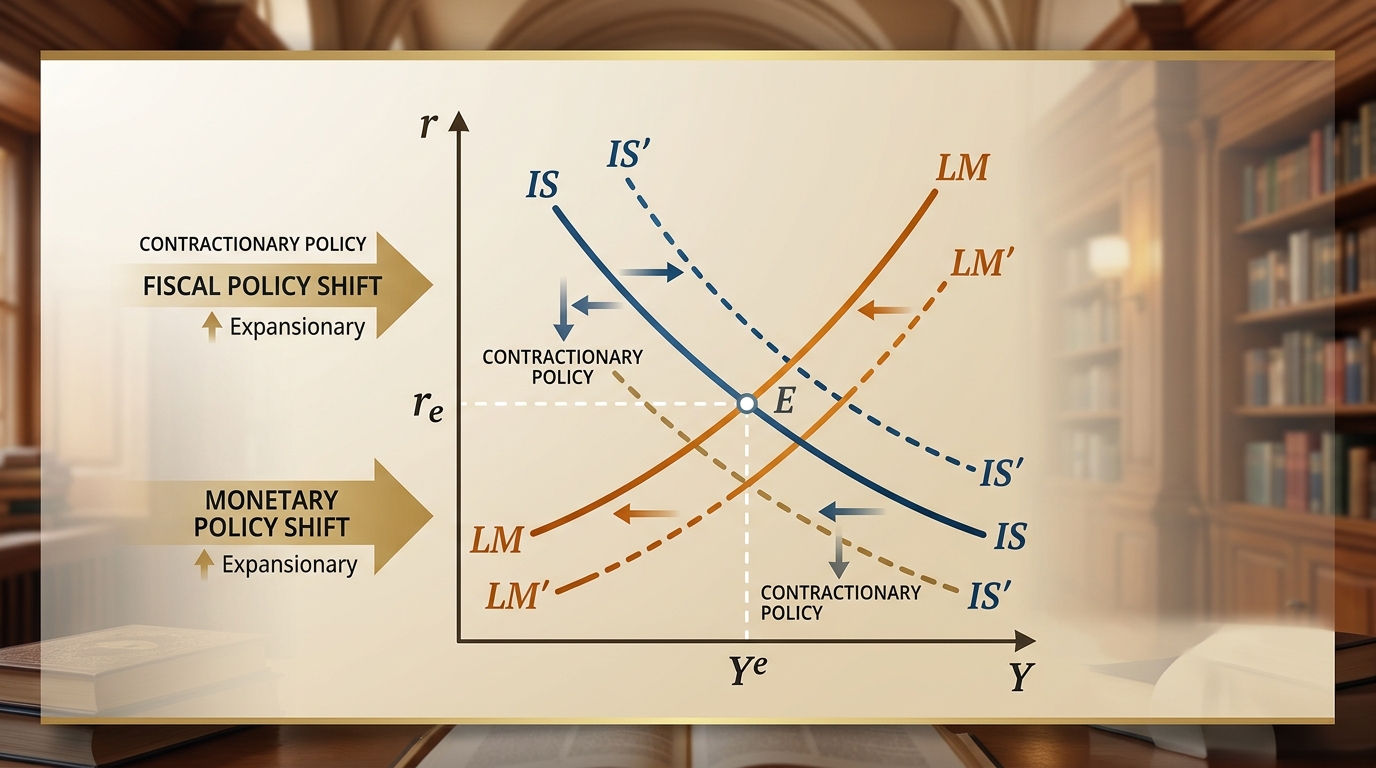
IS-LM Model: Goods & Money Market Equilibrium, Policy Multipliers & DU Exam Numericals
Comprehensive 4,000-word masterclass on the IS-LM model for DU Economics students. Covers algebraic derivations of IS and LM curves, general equilibrium, fiscal and monetary policy multipliers, crowding-out effect, liquidity trap, and 3 fully worked exam numericals.