GDP Deflator vs CPI: The 4,000-Word Comprehensive Comparison & Numerical Masterclass
Master GDP Deflator vs Consumer Price Index for DU macroeconomics. Paasche vs Laspeyres mathematical proofs, substitution bias derivations, 3 worked numerical calculations, MoSPI item weight breakdown, and WPI comparison.
In undergraduate macroeconomics papers across Delhi University and Indian central universities, inflation measurement is tested through two primary price indices: the Consumer Price Index (CPI) and the implicit GDP Deflator. While both track price level changes over time, they answer fundamentally different economic questions, utilize distinct weighting methodologies, and produce divergent inflation estimates.
In India, consumer inflation data is compiled and released monthly by the National Statistical Office (NSO) under the Ministry of Statistics and Programme Implementation (MoSPI), whereas official inflation targeting by the Reserve Bank of India (RBI) relies on the CPI (Combined) series.
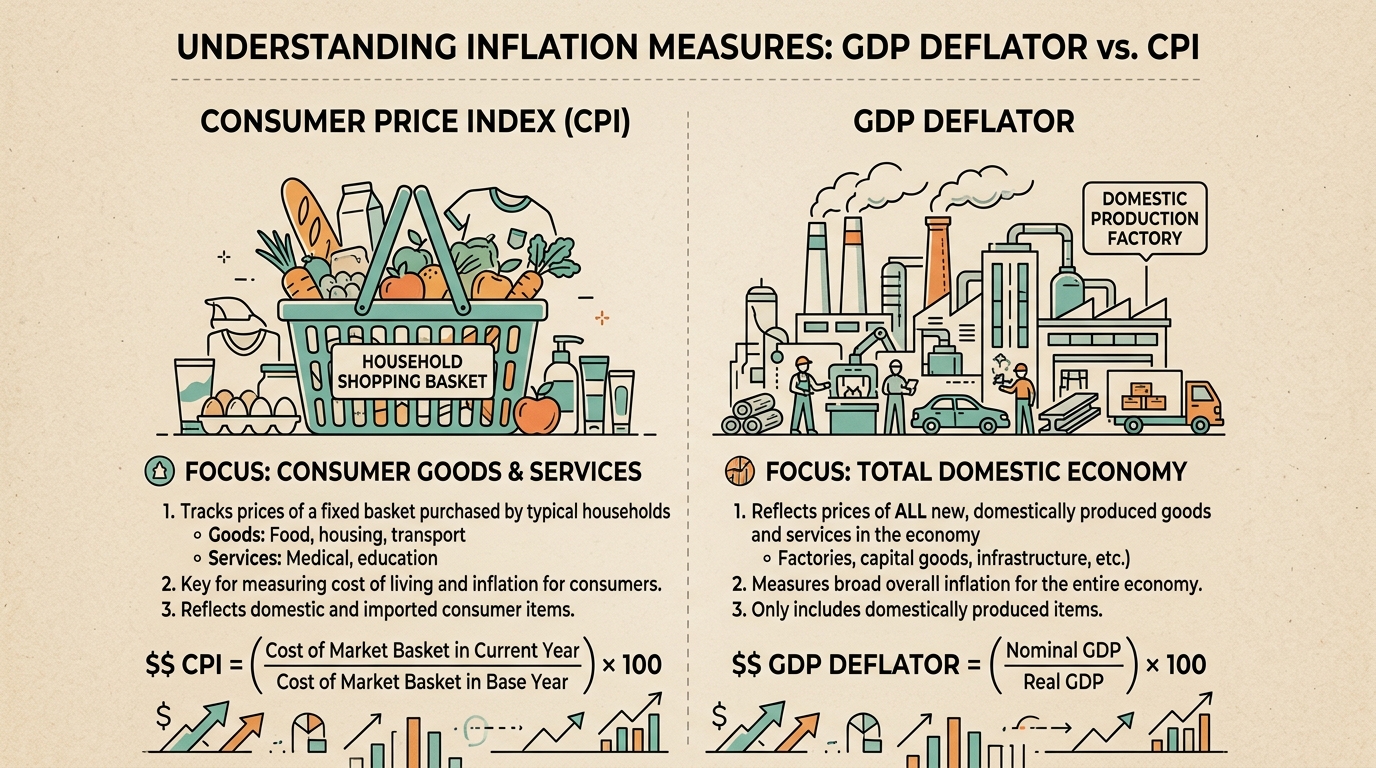
1. Key Conceptual Differences: Master Comparison Matrix
| Feature | GDP Deflator | Consumer Price Index (CPI) | Wholesale Price Index (WPI) |
|---|---|---|---|
| Coverage Basket | All domestically produced final goods and services in GDP. | Fixed basket of consumer goods and services purchased by typical households. | Bulk goods at wholesale stage (manufactured goods, fuel, primary articles). |
| Imported Goods | Excluded (GDP measures domestic production only). | Included if consumed by households (imported crude, electronics). | Included at wholesale trade level. |
| Index Weighting | Paasche Index (uses current-year quantities Qt as weights). | Laspeyres Index (uses base-year quantities Q0 as weights). | Laspeyres Index (uses base-year production value weights). |
| Substitution Bias | Understates inflation by allowing quantity substitution. | Overstates inflation by assuming fixed consumption weights. | Overstates wholesale inflation. |
2. Mathematical Proofs: Laspeyres vs. Paasche Index Bias
Let P0, Q0 denote base-year prices and quantities, and Pt, Qt denote current-year prices and quantities.
Laspeyres Index Formula (CPI)
Lt = [ Sum(Pit × Qi0) / Sum(Pi0 × Qi0) ] × 100
Paasche Index Formula (GDP Deflator)
Pt = [ Sum(Pit × Qit) / Sum(Pi0 × Qit) ] × 100 = (Nominal GDPt / Real GDPt) × 100
Proof of Substitution Bias
When the price of good A rises faster than good B, rational consumers substitute away from good A toward good B (QAt / QBt < QA0 / QB0). Because the Laspeyres CPI holds base-year quantities Qi0 fixed, it overweights the good whose price rose most, systematically overstating inflation. Conversely, because the Paasche GDP Deflator uses current-year quantities Qit, it underweights the good whose price rose most, systematically understating inflation.
3. MoSPI Indian CPI Item Weight Breakdown
According to NSO MoSPI guidelines published on mospi.gov.in, the CPI (Combined) series (Base Year 2012 = 100) assigns the following weights:
- Food and Beverages: 45.86% (Primary driver of CPI volatility in India).
- Housing: 10.07% (Urban housing rent index).
- Fuel and Light: 6.84% (LPG, electricity, kerosene).
- Clothing and Footwear: 6.53%.
- Pan, Tobacco, and Intoxicants: 2.38%.
- Miscellaneous (Health, Education, Transit): 28.32%.
4. Worked 10-Mark Exam Numerical Problem 1
An economy produces Rice (X) and Clothes (Y). Data for Base Year 0 and Current Year 1:
Year 0: PX0 = 10, QX0 = 50 | PY0 = 20, QY0 = 30
Year 1: PX1 = 15, QX1 = 60 | PY1 = 25, QY1 = 40
Calculate (a) CPI (Laspeyres Index), (b) Nominal & Real GDP, (c) GDP Deflator (Paasche Index), and (d) Inflation rate difference. [10 Marks]
Solution Breakdown
(a) CPI Calculation:
CPI1 = [ (15*50 + 25*30) / (10*50 + 20*30) ] * 100 = [ (750 + 750) / (500 + 600) ] * 100 = (1500 / 1100) * 100 = 136.36
CPI Inflation = 136.36 - 100 = 36.36%
(b) Nominal & Real GDP:
Nominal GDP1 = 15*60 + 25*40 = 900 + 1000 = 1,900
Real GDP1 = 10*60 + 20*40 = 600 + 800 = 1,400
(c) GDP Deflator Calculation:
GDP Deflator1 = (1900 / 1400) * 100 = 135.71
GDP Deflator Inflation = 135.71 - 100 = 35.71%
Difference: CPI inflation (36.36%) exceeds GDP Deflator inflation (35.71%) by 0.65% due to Laspeyres substitution bias.
5. Related Macroeconomics Reading
To understand how central banks respond to inflation metrics, explore our detailed analysis of Fiscal Policy vs Monetary Policy in India and Elasticity of Demand with Real Indian Market Data.
Frequently asked questions
Which index is the RBI's inflation target based on?
The RBI targets headline CPI inflation, not the GDP deflator or WPI.
Why can WPI and CPI move in opposite directions?
WPI is weighted heavily towards manufactured goods and fuels; CPI is dominated by food and services. Sector-specific shocks show up differently in each.
Is the GDP deflator a good measure of consumer inflation?
No. It reflects the price of everything produced, including exports and investment goods, not what households consume.
Dhairya sat the same DU papers he now writes about. Acadly is his attempt to say the useful things his own first-year self would have wanted to hear.
Keep reading
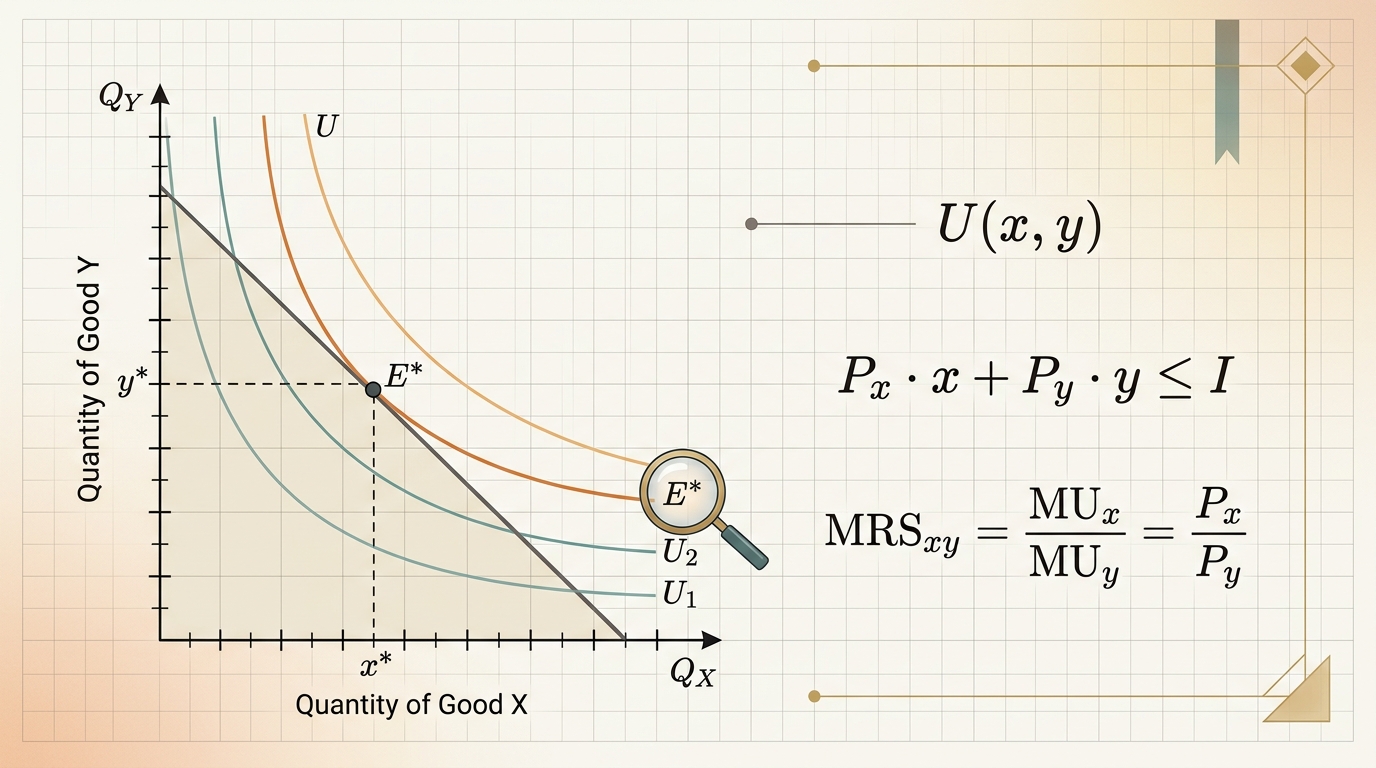
Consumer Theory & Indifference Curves: Utility Maximization, Budget Constraints & Exam Numericals
Comprehensive 4,000-word masterclass on Consumer Theory for DU Economics students. Covers utility functions, indifference curve properties, MRS derivation, budget constraint geometry, Lagrangian optimization, and 3 fully worked numerical problems.
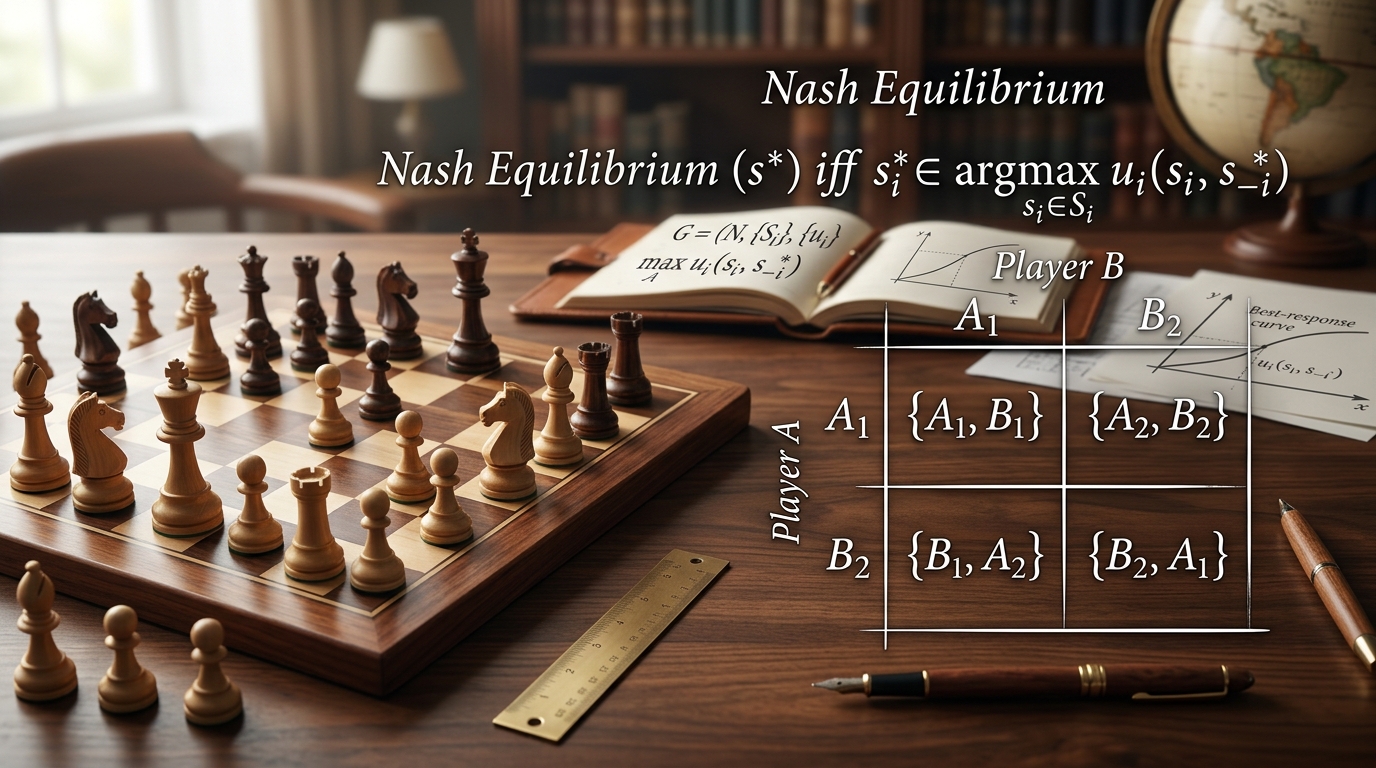
Game Theory & Nash Equilibrium: Mathematical Derivations, Payoff Matrices & Exam Numericals
Comprehensive 4,000-word masterclass on Game Theory and Nash Equilibrium for DU Economics students. Covers dominant strategies, Prisoner's Dilemma, mixed strategies, Cournot duopoly, and 3 fully worked numerical problems.
Mundell-Fleming Model: Fixed vs Floating Exchange Rates (Complete Derivations & Policy Efficacy)
Exhaustive 4,500-word masterclass on the Mundell-Fleming open economy macroeconomics model. Includes algebraic derivations of IS*, LM*, BP curves, Marshall-Lerner condition, and India's exchange rate policy.